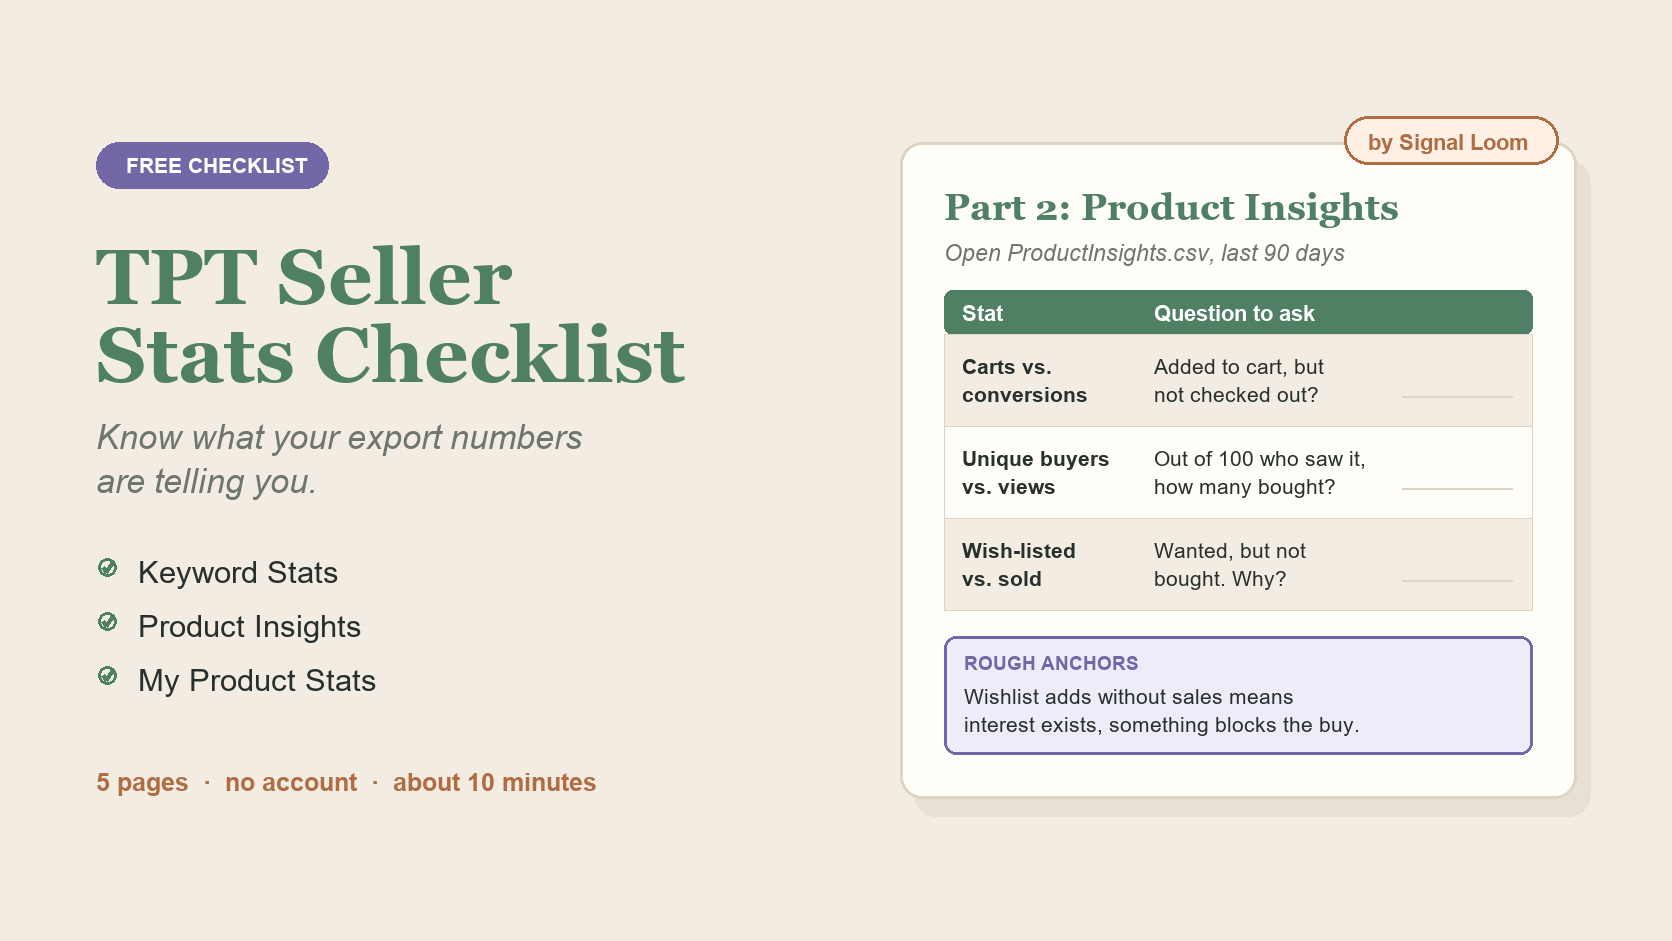
The free TPT Seller Stats Checklist deliberately does not tell you what your numbers should be. There is no such thing as a good conversion rate in the abstract, and a worksheet that hands you a target teaches you to chase someone else's store instead of reading your own.
What it does do is ask the right question at each stat. This page is the other half: one example store, walked through all three parts, so you can see what a pattern tends to point at once you have written your answers down.
Before you read any of it, set your date range to the last 90 days. The dashboard defaults to 30, and on most stores that is too short a window to separate a real pattern from a quiet fortnight. Every number below assumes the wider range.
Do not have the checklist yet? It is free, five pages, no account needed. Grab it from TPT and work through it alongside this page.
In short: use a 90-day view to spot patterns, not targets. The checklist helps you decide what a number may be pointing to, then choose one sensible next step for your own store.
This is the part sellers get backwards most often. A keyword row with plenty of visits and no sales feels like a keyword problem. It usually is not.
Here is the example store's Keyword Stats, four rows worth looking at:
| Row A | 340 visits, 0.4% conversion, crowded term with hundreds of competing resources |
| Row B | 26 visits, 9% conversion, specific phrase, few competing resources |
| Row C | 190 visits, 3% conversion, carries most of the store's keyword earnings |
| Row D | 410 visits, 1% conversion, broad single-word term |
Row A and Row D are the same story. People are arriving and leaving. The search term did its job, it brought a human to the listing. Whatever lost them happened after they got there: the promise, the cover, the preview, the price, or a grade level that did not match what they were hoping for. Rewriting the keyword will not fix any of those.
Row B is the one worth your attention, and it is the one most sellers skip because the number is small. Twenty-six visits converting at 9% is a niche where your listing is exactly what the searcher wanted. That is a signal to make more of the same thing, not to dismiss it for being small.
Row C is your load-bearing keyword. Worth knowing simply so you do not accidentally rewrite the title that earns it.
One caution before you act on any of this. The same keyword behaves differently on different products, so a term that converts on one listing may do nothing on another. And a small row is a small sample: a conversion rate built on a handful of visits is closer to noise than to a finding.
Product Insights is where you find out at which point interest stopped. Views, carts, wishlist adds and unique buyers each mark a different stage, and the gap between two of them is more informative than either number alone.
| Wishlist | 40 wishlist adds, 2 sales |
| Views | 900 views, 11 unique buyers |
| Carts | Added to cart regularly, low earnings per cart |
Forty wishlist adds against two sales is not rejection. Those forty people looked at your listing and decided they wanted it. Something is sitting between wanting and buying, and it is usually one of three things: price against their current budget, timing because the unit is not for another two months, or a last flicker of doubt about whether it is really going to work in their room. A preview that answers the doubt tends to move this more than a discount does.
Nine hundred views against eleven buyers is a different problem, and a more fixable one. People are finding the listing and not choosing it. Work in order of cheapness: the cover, then the preview, then the description, then the price. Change one, wait, see what moves. Changing four at once buys you a result you cannot attribute.
Low earnings per cart is worth a look but rarely worth a panic. Sometimes it is a genuinely underpriced product. Sometimes it is a small resource doing exactly its job as an entry point into your store.
Loud failures are easy. A product with no views at all is obviously invisible. The quiet underperformer is the one with real page views, a respectable position in your store, and almost nothing to show for it.
Two patterns from My Product Stats are worth checking specifically:
Before you cut anything, check what job it is doing. A product can look terrible in isolation and still be the free lead-in that brings buyers into your store, or the filler that makes a bundle worth its price. Judge it by its role, not by its own row.
You should now have three or four observations and a short list of products. The temptation is to fix all of them this weekend. Do not.
Pick one. Make the change. Write the date. Come back in a few weeks, not a few days, because new data needs time to accumulate before it means anything. If you want a structure for that return visit, the thirty-minute check-in is built for exactly that loop.
I build classroom resources for grades 7 to 12, and I kept running into the same problem with my own store: the exports told me plenty and explained nothing. So I built a tool to do the reading for me, and the checklist is the manual version of the questions that tool asks.
Signal Loom takes the same three exports you just worked through, Keyword Stats, Product Insights and My Product Stats, and turns them into plain-English signals: which keywords are carrying the store, which listings are losing people and at which stage, and what is worth trying next. It reads the files you already download from TPT. There is no scraping, no dashboard access, and nothing to connect.
The free tier analyses a full snapshot and keeps an action log of what you decided to try, which is the part the paper version cannot do for you.
Signal Loom reads the exports you already have and turns them into plain-English signals, without the manual checklist work. Free to start, no card needed.